 哈尔滨银行2020中期业绩发布会-ENG.pdf
哈尔滨银行2020中期业绩发布会-ENG.pdf
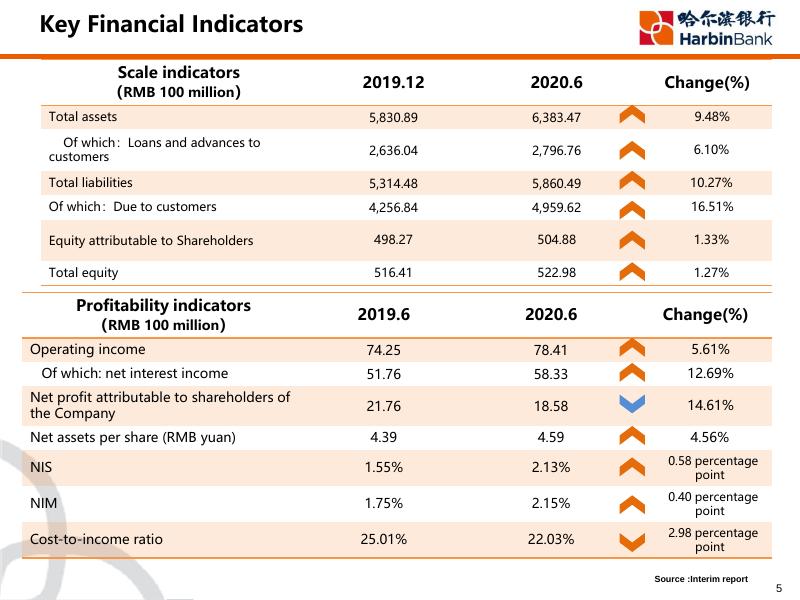
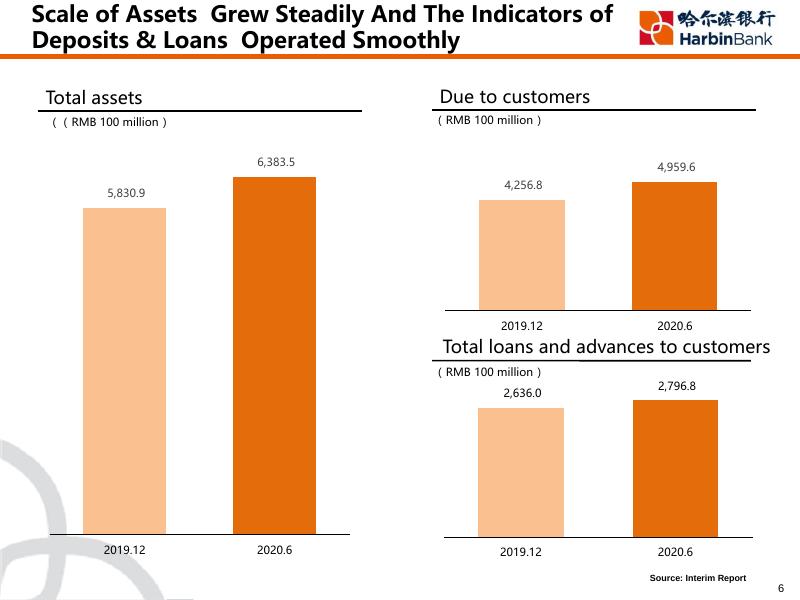
Stock code:HK.6138 August, 2020, Harbin Disclaimer The information contained in this material does not form an offer or an invitation proposal to purchase or subscribe the securities of Harbin Bank Co., Limited (the “Company") in Hong Kong, the United States or any other regions. The securities of the Company is neither registered under the Securities Act of 1933 nor in its revision, shall not be offered or sold in the United States, except its registration in accordance with the applicable laws or exempted from registration. This announcement contains “forward-looking statements” defined in Article 27A of the Securities Act of 1933 (Revised) and Article 21E of the Securities Exchange Act of 1934 (Revised). These forward looking statements involve known or unknown risks, uncertainties and other factors, and are made based on the Company's existing industry expectations, assumptions, forecast and prediction. Unless otherwise required by law, the Company does not undertake any obligation to update forward-looking statements to reflect events or circumstances in the future will not bear the corresponding changes to its expected duty. Although the Company believes that the expectation described in the forward-looking statements are reasonable, it does not assure you that the expectations in the future will prove to be correct, and investors should pay attention that the actual results may have difference with the prediction results. 2 Content 1 2 Financial Performance Business Operation 3 4 Risk Management Prospect 3 01 Financial Performance 4 Key Financial Indicators Scale indicators (RMB 100 million) 2019.12 2020.6 Change(%) Total assets 5,830.89 6,383.47 9.48% Of which:Loans and advances to customers 2,636.04 2,796.76 6.10% Total liabilities 5,314.48 5,860.49 10.27% Of which:Due to customers 4,256.84 4,959.62 16.51% Equity attributable to Shareholders 498.27 504.88 1.33% Total equity 516.41 522.98 1.27% 2019.6 2020.6 Change(%) 74.25 78.41 5.61% 51.76 58.33 12.69% Net profit attributable to shareholders of the Company 21.76 18.58 14.61% Net assets per share (RMB yuan) 4.39 4.59 4.56% NIS 1.55% 2.13% 0.58 percentage point NIM 1.75% 2.15% 0.40 percentage point Cost-to-income ratio 25.01% 22.03% 2.98 percentage point Profitability indicators (RMB 100 million) Operating income Of which: net interest income Source :Interim report 5 Scale of Assets Grew Steadily And The Indicators of Deposits & Loans Operated Smoothly Due to customers Total assets ( RMB 100 million ) (( RMB 100 million ) 6,383.5 4,959.6 4,256.8 5,830.9 2019.12 2020.6 Total loans and advances to customers ( RMB 100 million ) 2,636.0 2019.12 2020.6 2019.12 2,796.8 2020.6 Source: Interim Report 6 Steady Increased of Operating Income, And The Cost Management Effect Was Remarkable Cost-to-income ratio Operation income ( RMB 100 million ) 74.25 2019.6 78.41 25.01% 22.03% 2020.6 Net profit attributable to shareholders ( RMB 100 million ) 21.76 2019.6 2020.6 Net assets per share (RMB yuan/ share) 4.39 4.59 2019.6 2020.6 18.58 2019.6 2020.6 Source:Interim report 7 NIS & NIM Increased, Profitability Remained Stable Interest income Interest income structure ( RMB 100 million ) 2019.6 51.76 94.38 Investments in debt securities cash and balance with central bank 2020.6 58.33 2.6% 30.7% Due from banks and other financial institutions 1.3% 5.4% Long receivables 81.26 60.0% Net interest income Loans and advances to customers Interest expense Profitability indicators Items 2019.6 2020.6 change Yield of interest earning assets 4.93% 5.14% +21bps Cost rate of interestbearing liabilities 3.38% 3.01% -37bps NIS 1.55% 2.13% +58bps NIM 1.75% 2.15% +40bps Source:Interim report 8 02 Business Operation 9 Regional Development Increasingly Balanced, And Branches Operated Steadily City commercial bank with most subsidiaries in China ✓ Harbin Branch Heilongjiang 132 Sub-branches Harbin Branch Jilin ✓5 Branches outside Heilongjiang Beijing ✓ 11 Branches inside Heilongjiang 78 Sub-branches ✓ 32 Village and Township Banks 43 Village and Township Sub-branches Shenyang Branch Dalian Branch Tianjin Branch Liaoning 75 Sub-branches Hebei Gansu Sichuan Jiangsu Henan Chengdu Branch Chongqing Branch Hubei Hunan Jiangxi ✓ Harbin Bank Financial Leasing Co., Ltd. Guangdong ✓ Harbin Bank Consumer Finance Co., Ltd. Provinces / municipalities with business establishments Hainan Source: Interim Report 10 Retail Business Transformation Achieved Remarkable Results, With Explicitly Effect of “Deposit as The Foundation” Total retail deposits The average balance of retail deposits ( RMB 100 million ) ( RMB 100 million ) 2,658.2 2,469.2 2,295.6 1,688.4 2019.12 2020.6 Cost ratio of retail deposit 4.11% 0.36% 2019.12 2020.6 Total retail loans 3.97% ( RMB 100 million ) 1,190.8 1,190.6 2019.12 2020.6 0.36% 2019.6 2020.6 Demand Time Source: Interim Report 11 The Number of Retail Customers Progressively Increased , And The Credit Card Business Developed Steadily Number of deposit customers (10 thousand) 1,315.9 1,337.0 2019.12 2020.6 Number of value customers ( 10 thousand ) Credit card issuing volume ( 10 thousand ) 106.87 114.21 2019.12 2020.6 Balance of credit card assets ( RMB 100 million ) 75.45 81.76 2019.12 2020.6 137.9 139.0 2019.12 2020.6 Source: Interim Report 12 The Position of Microcredit Was Consolidated, And Featured Business Operated Well Microcredit loans Sino-Russia financial services ( RMB 100 million ) 1,784.4 126.9 1,858.5 166.7 ✓ Total interbank credit to Russian banks RMB 8 billion ✓ Cross-border transportation of RMB cash 362 million ✓ The membership of Sino-Russian Financial Union had grown to 72 652.5 681.0 ✓ 23 Russia accounting banks with domestic and foreign currency settlement network covering entire Russia ✓ Handled the first NRA account settlement business in the Heilongjiang Pilot Free Trade Zone 667.9 593.6 ✓ Launched featured exchange rate hedging product The cross-border E-commerce business 383.0 371.4 ✓ 2,584 cross-border E-commence customers ✓ 2019.12 2020.6 Loans to farmers Personal consumption loans RMB15 billion ✓ The first domestic commercial bank to cooperate with the Russian World Card channel Loans to small enterprises Loans to small enterprise owners Aggregate transaction settlement volume reached ✓ Supported more than ten foreign payment tools such as MASTERCARD, JCB and YANDEX Source: Interim Report 13 Corporate Finance Business Stably Developed, With Steady Growth of Business Indicators Operating income of corporate finance Corporate deposits ( RMB 100 million ) ( RMB 100 million ) 34.56 28.73 2019.6 2020.6 1,405.8 1,961.2 2019.12 2020.6 Cost ratio of corporate deposits Corporate loans ( RMB 100 million ) 2,301.4 1,572.7 4.11% 1.08% 0.85% 2019.6 2019.12 2020.6 3.68% 2020.6 Demand Time Source: Interim Report 14 Financial Market Business Stably Operated, With Progressively Decreased Funding Cost Operating income of interbank finance ( RMB 100 million ) ( RMB 100 million ) 21.63 22.52 2019.6 2020.6 Cost of interbank liabilities 4.39% Total bond investment 3.94% 3.97% 667.3 2019.12 755.0 2020.6 Wealth management business ✓ The balance of non-principal protected wealth 3.44% management products amounted to RMB 62.470 billion ✓ The balance of net-value wealth management products amounted to RMB14.019 billion Due to banks Debt securities issued and others 2019.6 2020.6 ✓ Wealth management customers reached 891.2 thousand ✓ Establishment of the “fixed income +” product series ✓ 2019 Excellent City Commercial Bank for Banking Wealth Management Registration Source: Interim Report 15 Operational Support Improved, With More Resources Allocated to Fin-tech Online banking customers (ten thousand) 352.3 317.3 2019.12 61.0% 194.3 2020.6 2019.12 Mobile Channel Replacement Rate 2019.12 2019.12 15 15 Card issuance Mobile banking customers (ten thousand) We-chat banking customers (ten thousand) 229.2 254.7 265.8 2020.6 2019.12 2020.6 63.0% 93.0% 2020.6 2019.12 Electronic Channel Replacement Rate 2020.6 No. of self-service equipments (sets) 2020.6 87 87 130 191 Multi-media inquiry Non-cash super counters 218 94.5% 472 232 Smart cabinets 310 484 310 ATMs BCDMs Source: Interim Report 16 Actively Practicing Social Responsibility With Remarkable Results in Brand Building Gave play to the advantages of Fin-Tech, and launched the “seven financial measures for fighting the epidemic situation together” by formulating special service measures, integrating resources, enriching online service functions, and strengthening science and technology operation guarantee and so on, to meet the demand for financial services in special periods, and promoted to the fight against the epidemic situation and resume work and production. Held online promotion conference on featured SinoRussia financial products, and launched a number of measures to help enterprises to relieve difficulties, so as to further promote the resumption of foreign trade enterprises. Provided liquidity loans for micro enterprises focusing on epidemic prevention and control, effectively supported enterprises to resume work and production, and reduced the financing cost of micro enterprises. Brand Finance 191th in “2020 Brand Finance Global 500” 《The Banker》 199th in “Top 1000 World Banks 2020” 31th in the “2019 China Banking Top 100 List 03 Risk Management 18 The Level of Capital Remained Adequate And Managed Capital With More Proactive Approaches More proactive capital management Net Capital (RMB 100million) 621.5 615.9 mechanism, effectively conducted regulatory requirements, while carried out the requirements of capital management as preplanned, and continued to strengthen the fundamental capacity of capital management. 510.7 503.1 ✓Further improved the capital management ✓Built a steady internal capital adequacy 2019.12 2020.6 Tier 1 Capital Net Capital Capital Adequacy Ratios 12.53%12.30% 10.22%10.08% ✓Adhere to the capital constraint principle, 10.24%10.10% Core tier 1 capital Tier 1 capital Captial adequacy adequacy ratio adequacy ratio ratio 2019.12 evaluation procedure. According to the Bank’s comprehensive risk management framework, various substantive risk assessments and results of stress tests, the Bank rationally planned its capital usage, so that the Bank’s capital adequacy level, operational planning and financial planning achieved a dynamic balance. enhanced capital management. Comprehensive application of risk pricing mechanism across the Bank, which based on risk-adjusted returns, and solidified into operation systems, in order to realize the differentiated risk pricing on transaction-by-transaction manner, and maximized the risk-adjusted return of the Bank’s assets. 2020.6 Source: Interim Report 19 Assets Quality Remained Stable And Controllable, Impairment Provision Sufficiently Accrued Assets Quality Loan Impairment Loss Reserve Ratio (RMB 100million) 52.52 66.89 NPLs 80.08 88.76 3.04% 3.17% 2019.12 2020.6 Balance of loan impairment provision 2019.12 2020.6 Non-performing Loan Ratio 2.39% 1.99% Management & Control Measures for Assets Quality ✓ Formulate risk prevention and control measures under the COVID-19 pandemic to reduce the impact on asset quality. ✓ Utilized advanced fin-tech applications to build a intelligential risk control system. ✓ Strengthened the credit assets quality control of entire business process for existing customers, to prevent downward movements of asset quality indicators. 2019.12 2020.6 ✓ Rigorous control of new customers' entrance, imposed quota management in term of industrial, regional and highly risky areas. ✓ Established a centralized collection mechanism for nonperforming assets, and implement rigid ownership transfer management. 20 Source:Interim report, CBIRC Risk Control Kept Strengthening, Risk Management System Increasingly Improved Credit Risk Risk measurement model was continuously improved, and the results of the internal evaluation system were in-depth applied in areas such as customer entrance, post-loan management, risk policy, risk pricing, provision for impairment, and economic capital. In the aspect of collateral risk valuation, the Bank constructed land management rights data warehouse of agricultural loan, self-developed automatic evaluation model for office buildings and commercial housing, improving automated evaluation capabilities constantly. Liquidity Risk Improved the level of cash position management meticulousness, proactively adjust structure of assets and liabilities, expanded and diversified financing channels, in result, the liquidity risk resistance capacity was enhanced. Market Risk Comprehensively implemented market risk management preferences, optimized market risk management and control procedures, ensure that market risk management is accurately measured, carefully managed, properly implemented and effectively prevented. Operational Risk Strengthened the substantive application of the three major management tools of operational risk, namely RCSA, KRI and LDC, emphasized to focus on the internal anti-fraud, standardized risk assessment procedures of resignations. Information Technology Risk Refined the IT management process, and with the help of financial technology means, the efficiency of work mode and method is steadily improved, and the implementation of business requirements is effectively promoted. enhanced the IT outsourcing management, and consistently improved the outsourcing risk management level. Compliance Risk Deepened the integrated management idea of "prevention, control, inspection and revise", improved the fine management level of internal control and compliance, and improved the comprehensive internal control and compliance risk management system that adapted to the transformation of business development. 21 04 Prospect 22 Main Strategic Plan For 2H 2020 Three major campaigns reinvigorate Asset allocation NPLs collecting Optimisation of deposit structure Three major transform re-deepen Branch retail transformation Service mode transformation for corporate customer team Transformation of credit approval mode Technology empowerment re-upgrade Technology research system Fin-tech application Tech fundamental capacity Foundation shaping reinforce New strategic plan Asset allocation management Basic management of compliance and internal control Promoting brand image Pandemic control re-persevere 23 Q&A Appendix:Financial Statements Of 1H 2020 Profit & Loss (Million RMB) 2019 Jan-Jun 2020 Jan-Jun Change Operating income 7,424.6 7,840.9 5.61% Of which: Net interest income 5,175.8 5,832.8 Net fee and commission income 1,462.2 Net profit Net profit attributable to shareholders of the Bank Net assets per share attributable to shareholders of the Bank Profitability(%) Assets & Liab. (Million RMB) 2019.12.31 2020.6.30 Change Total assets 583,089.4 638,346.5 9.48% 12.69% Of which: Loans and advances to customers 263,604.1 279,675.6 6.10% 1,057.8 -27.66% Total Liabilities 531,448.2 586,048.8 10.27% 2,208.9 1,853.3 -16.10% Of which: Due to customers 425,683.7 495,962.0 16.51% 2,175.7 1,857.8 -14.61% Share capital 10,995.6 10,995.6 —— Total equity 51,641.2 52,297.7 1.27% 2019.12.31 2020.6.30 Change % Core tier 1 capital adequacy ratio 10.22% 10.08% -0.14 Tier 1 capital adequacy ratio 10.24% 10.10% -0.14 Capital adequacy ratio 12.53% 12.30% -0.23 4.39 4.59 4.56% 2019 Jan-Jun 2020 Jan-Jun Change % Assets quality indicators(%) Return on average total assets 0.71% 0.61% -0.10 Return on average equity 9.20% 7.41% -1.79 NPLs ration 1.99% 2.39% 0.40 Net interest spread 1.55% 2.13% 0.58 Impairment losses on loans 3.04% 3.17% 0.13 Net interest margin 1.75% 2.15% 0.40 Net fee and commission income to operating income ratio Impairment coverage ratio 152.50% 132.69% -19.81 19.69% 13.49% -6.20 Other indicator(%) 2019.12.31 2020.6.30 Change % Cost-to-income ratio 25.01% 22.03% -2.98 61.92% 56.39% -5.53 Loan-deposit ratio Source:Interim report 25 Thank You!