 哈尔滨银行2019年度业绩发布会-ENG.pdf
哈尔滨银行2019年度业绩发布会-ENG.pdf
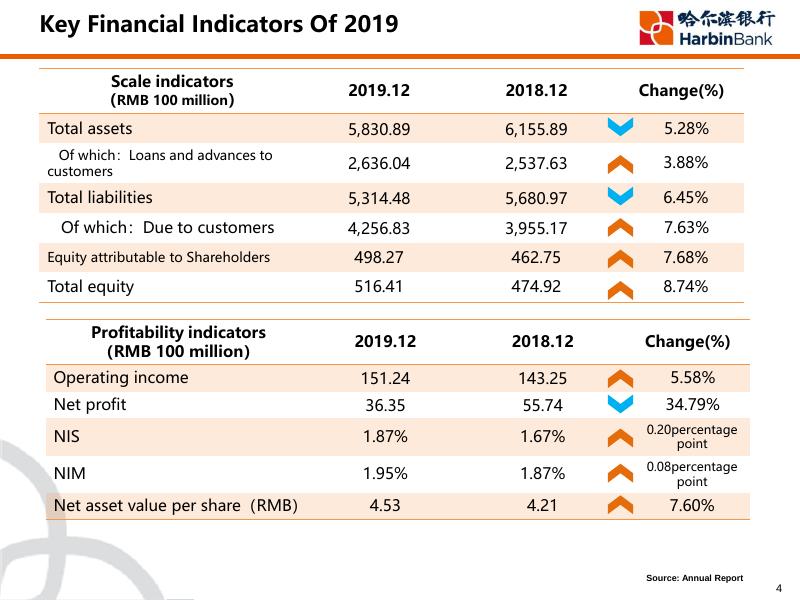
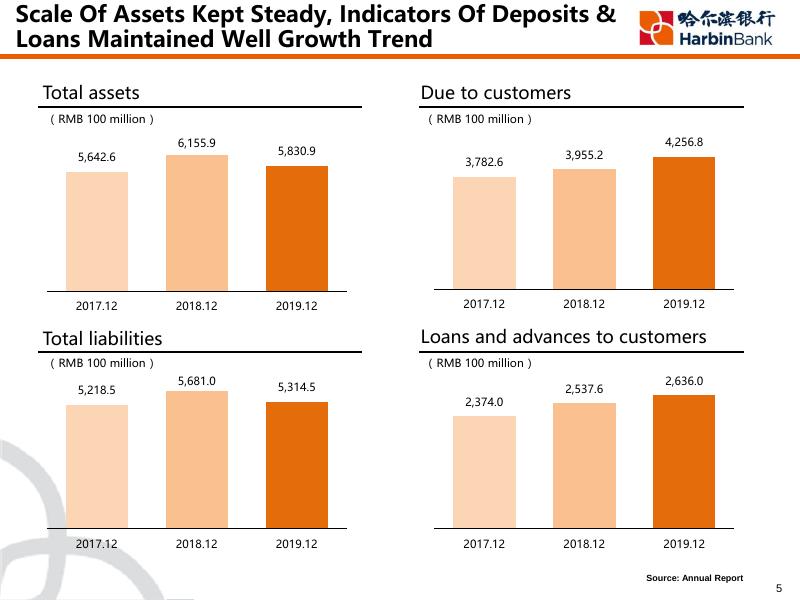
Stock code:HK.6138 March, 2020, Harbin Disclaimer The information contained in this material does not form an offer or an invitation proposal to purchase or subscribe the securities of Harbin Bank Co., Limited (the “Company") in Hong Kong, the United States or any other regions. The securities of the Company is neither registered under the Securities Act of 1933 nor in its revision, shall not be offered or sold in the United States, except its registration in accordance with the applicable laws or exempted from registration. This announcement contains “forward-looking statements” defined in Article 27A of the Securities Act of 1933 (Revised) and Article 21E of the Securities Exchange Act of 1934 (Revised). These forward looking statements involve known or unknown risks, uncertainties and other factors, and are made based on the Company's existing industry expectations, assumptions, forecast and prediction. Unless otherwise required by law, the Company does not undertake any obligation to update forward-looking statements to reflect events or circumstances in the future will not bear the corresponding changes to its expected duty. Although the Company believes that the expectation described in the forward-looking statements are reasonable, it does not assure you that the expectations in the future will prove to be correct, and investors should pay attention that the actual results may have difference with the prediction results. 1 Content 1 2 Financial Performance 3 Business Operation 4 Risk Management Prospect 2 01 Financial Performance 3 Key Financial Indicators Of 2019 Scale indicators (RMB 100 million) 2019.12 2018.12 Change(%) Total assets 5,830.89 6,155.89 5.28% Of which:Loans and advances to customers 2,636.04 2,537.63 3.88% Total liabilities 5,314.48 5,680.97 6.45% Of which:Due to customers 4,256.83 3,955.17 7.63% Equity attributable to Shareholders 498.27 462.75 7.68% Total equity 516.41 474.92 8.74% 2019.12 2018.12 Change(%) Operating income 151.24 143.25 5.58% Net profit 36.35 55.74 34.79% NIS 1.87% 1.67% 0.20percentage point NIM 1.95% 1.87% 0.08percentage point Net asset value per share(RMB) 4.53 4.21 7.60% Profitability indicators (RMB 100 million) Source: Annual Report 4 Scale Of Assets Kept Steady, Indicators Of Deposits & Loans Maintained Well Growth Trend Total assets Due to customers ( RMB 100 million ) ( RMB 100 million ) 6,155.9 5,642.6 2017.12 2018.12 5,830.9 2019.12 3,782.6 2017.12 3,955.2 2018.12 4,256.8 2019.12 Total liabilities Loans and advances to customers ( RMB 100 million ) ( RMB 100 million ) 5,218.5 2017.12 5,681.0 5,314.5 2,374.0 2018.12 2019.12 2017.12 2,537.6 2018.12 2,636.0 2019.12 Source: Annual Report 5 Steady Increased Of Operating Income, And The Company Value Continued to Rise Operating income Net profit ( RMB 100 million ) ( RMB 100 million ) 151.2 141.3 143.3 2017.12 2018.12 53.1 55.7 36.4 2019.12 2017.12 2018.12 Total equity Net assets value per share ( RMB 100 million ) ( RMB Yuan per share) 424.1 2017.12 474.9 2018.12 516.4 3.75 2019.12 2017.12 4.21 2018.12 2019.12 4.53 2019.12 Source: Annual Report 6 Interest Income Kept Solid Growth, Profitability Remained Stable Interest income Interest income structure ( RMB 100 million ) 2019.12 2018.12 108.4 101.3 Net interest income 175.9 Long-term receivables Due from banks and other financial institutions 175.0 5.7% 32.2% 2.5% 2.6% 57.1% Interest expense Profitability indicators Investments in debt securities cash and balance with central bank Loans and advances to customers Items 2019.12 2018.12 Change Yield of interest earning assets 5.11% 5.09% +2bps Cost rate of interestbearing liabilities 3.24% 3.42% -18bps NIM 1.95% 1.87% +8bps NIS 1.87% 1.67% +20bps Source: Annual Report 7 02 Business Operation 8 Regional Development Increasingly Balanced, And Branches Operated Steadily Proportions of operating income in each of the geographical regions City Commercial Bank with Most Domestic Subsidiaries Other regions 2.8% Northern China Southwestern China 10.4% Heilongjiang 16.8% Other regions in Northeastern China Heilongjiang region Harbin Branch Jilin 11.2% Liaoning 58.8% Beijing Shenyang Branch Dalian Branch Hebei Tianjin Branch Proportions of assets in each of the geographical regions Gansu Other regions 1.7% Northern China Southwestern 7.7% 9.4% China Other regions in Northeastern China 7.4% Heilongjiang region Sichuan Henan Jiangsu Chengdu Branch Hubei Hunan Jiangxi Chongqing Branch 73.9% Guangdong Hainan Source: Annual Report 9 The Advantages Of Holding Licenses Tend To Emerge, Well Developing Tendency At Group Level Total assets of HB Leasing Total assets of HBCF ( RMB 100 million) ( RMB 100 million) 233.7 2018.12 248.5 71.64 73.88 2019.12 2018.12 2019.12 Net profit of HB Leasing Net profit of HBCF ( RMB 100 million) ( RMB 100 million) 2.76 1.07 1.74 0.50 2018.12 2019.12 2018.12 2019.12 Source: Annual Report 10 Retail Business Transformation Achieved Remarkable Results, With Explicitly Effect Of “Deposit As The Foundation” Operating income of retail business Total retail loans ( RMB 100 million ) ( RMB 100 million ) 41.20 2018.12 44.08 2019.12 Total retail deposits 1,153.9 1,190.8 2018.12 2019.12 Proportion of retail deposits ( RMB 100 million ) 2,295.6 1,423.1 36.0% 64.0% 2018.12 2019.12 2018.12 Retail 53.9% deposits Other deposits 46.1% 2019.12 Source: Annual Report 11 Retail Customers Increased Steadily, Credit Cards Business Remained Sound Number of deposit customers Number of issued credit cards ( Ten thousand ) ( Ten thousand ) 1,225.3 1,315.9 106.87 74.76 2018.12 2019.12 2018.12 2019.12 Number of value customers Balance of credit card assets ( Ten thousand ) ( RMB 100 million ) 56.85 137.9 75.45 108.1 2018.12 2019.12 2018.12 2019.12 Source: Annual Report 12 The Status Of Microcredit Was Consolidated, And Assets Quality Was Gradually Optimized NPL ratio of loans to small enterprises owners The proportion of microcredit 3.34% 3.32% 2018.12 2019.12 Other loans 32.3% 67.7% microcredit NPL ratio of loans to consumers 1.79% 1.35% Structure of microcredit 2018.12 loans to farmers 7.1% 38.2% personal consumption loans loans to small enterprises 33.3% 2019.12 NPL ratio of loans to farmers 4.27% 3.20% 21.5% loans to small enterprises owners 2018.12 2019.12 Source: Annual Report 13 Sino-Russia Finance Held Market Leadership, Cross-border E-commerce Special Features Maintained Trading volume of ruble spot exchange (Ruble 100 million) 800.0 Cross-border finance ✓Ranked 1st in the interbank foreign exchange market in terms of RUB transaction volume; ✓22 account banks in Russia; 587.6 ✓ Total interbank credit to Russian banks amounted to RMB 8 billion; ✓ The membership of Sino-Russian Financial Union had grown to 72; 2018.12 2019.12 RMB cash transfer volume (RMB ten thousand) 19,200 ✓ Heilongjiang’s first Chinese-funded USD debt business of RMB 500 million. E-commerce payment and settlement platform ✓ Transaction settlement volume of RMB 1.732 billion; ✓ Intermediary business income of RMB 32 million; ✓ Market share exceeded 15% , ranking 3rd in the industry; 4,000 2018.12 2019.12 ✓ Hosts cross border e-commerce 2,514 merchants; ✓ Available for MasterCard /JCB/mainstream payment tools in Russia and online banking of commercial banks. Source: Annual Report 14 Corporate Finance Business Stably Developed, Profitability Significantly Improved Operating income from corporate finance Corporate loans ( RMB 100 million ) ( RMB 100 million ) 60.66 1,383.4 1,405.8 2019.12 2018.12 2019.12 40.36 2018.12 Interest rates of corporate deposits and loans 5.99% 3.03% 6.02% Corporate customers (ten thousand) 9.16 9.37 2018.12 2019.12 2.74% Avg.cost of corporate Avg.yield of corporate loans deposits 2018.12 2019.12 Source: Annual Report 15 Financial Market Business Stably Operated, With Progressively Decreased Funding Costs Total investment in securities and other financial assets Aggregate cash exchange (RMB 100 million ) (RMB trillion) 2,260.1 2,337.0 3.42 1.83 2018.12 2019.12 Cost of interbank liabilities 4.68% 4.20% 2018.12 2019.12 Wealth management business ✓ Balance of wealth management products 4.64% 3.85% amounted to RMB 65.657 billion ✓ Balance of net-value wealth management products amounted to RMB13.393 billion ✓ Wealth management customers reached RMB 814.5 thousand ✓ Released a series of “fixed period open & close" products. Due to banks 2018.12 Debt securities issued 2019.12 ✓ Ranked 10th in overall wealth management capability among 124 city commercial banks Source: Annual Report, Ranking report on wealth management ability of banks (2018) 16 Operational Support Improved, With More Resources Allocated To Fin-tech Mobile banking customers (ten thousand) Online banking customers (ten thousand) 317.3 230.2 194.3 222.4 2019.12 2018.12 254.7 117.2 2018.12 2019.12 51% Mobile Channel Replacement Rate 2018.12 2018.12 2018.12 We-chat banking customers (ten thousand) 61% 91% 2019.12 2018.12 93% 2019.12 475 No. of self-service equipments (sets) 2019.12 Electronic Channel Replacement Rate 2019.12 342 472 310 218 94 13 87 130 134 15 card issuance multi-media inquiry non-cash super counters smart cabinets ATMs BCDMs Source: Annual Report 17 Share Transfer And Introduction Of Strategic Investors Successfully Completed, Governance Transformation Comprehensively Improved Introduction of strategic investors Harbin Economic Development 29.63% Heilongjiang Financial Holdings Business model transformation Transformation of branch construction Retail exclusive sub branch “standardized + featured” hall Light-weight organization “center + satellite" layout 18.51% Service transformation of corporate finance team Braches out of Heilongjiang established professional service team Braches inside Heilongjiang set up headquarter depart. correspond supportive team Transformation of credit approval mode 30% Corporate approval restructure of credit examination committee Retail approval strategy application of “model + rule" Launched "Joint Laboratory of Fin-tech" with Du Xiaoman Launched “Management innovation cooperation plan” with Deloitte China Source: Annual Report 18 Brand Features Became More Distinctive , With Continuous Improvement of Market Image Ranked 199th in “Top 1000 World Banks 2019” according to The Banker Ranked 217th in “Brand Finance Global 500 2019” published by Brand Finance Ranked 34th in the “2018 China Banking Top 100 List” Ranked 13th in the “City Commercial Banks The 33rd World’s Best Annual Report in China Golden Award of “Social Responsibility with Asset Size of more than RMB200 Report” of the 33rd World’s Best billion in 2018 for the Ranking of the Annual Report Special Award GYROSCOPE Evaluation System” Ranked 1117th in the Forbes Global 2000 2019 Cross-border Financial Service Bank 2019 Outstanding Retail Loan Bank Source: Annual Report, Public information 19 Public Welfare Image Continuously Improved By Practicing Social Responsibility Contributed to “The Belt and Road” Persisted in targeted poverty alleviation Promoted the happy community program Practiced social welfare Proposed green finance Supported education Initiated the establishment of the Sino- Made RMB137million poverty alleviation loans; Named Harbin International Marathon; Russia Financial Union, Held the 5th Supported 4,363 filing and card establishment Sponsored Chengdu International Marathon; member conference and organized customers ; Held Russian oil painting sculpture exhibition. participating in the St. Petersburg The balance of targeted poverty alleviation International Economic Forum. loans was RMB390 million. Covered 7 cities including Shenyang, The green credit balance was 1.781 billion; Continued to finance “Harbin Bank Lilac Blossom, Dalian, Tianjin, Chengdu, Chongqing, Cooperated with environmental protection Dream Achievement Hope Project”,” Harbin Shenzhen, Harbin, etc and had carried out industry and provided comprehensive financial Institute of Technology Education Foundation of more than 1000 activities in total service support to member enterprises Development" and “Hongyi Education Association” 20 03 Risk Management 21 Steadily Improved Capital Adequacy Level, With More Proactive Capital Managerial Approaches Utilized Net Capital Capital management – more proactive ( RMB 100million) ✓Further improved the capital management 625.9 Tier 1 capital 582.2 Net capital 467.4 503.1 2018.12 2019.12 Capital Adequacy Ratios 10.22% 9.74% Core tier 1 capital adequacy ratio 12.53% 12.15% 10.24% 9.75% Tier 1 capital mechanism, effectively conducted regulatory requirements, while carried out the requirements of capital management as preplanned, and continued to strengthen the fundamental capacity of capital management. At the end of 2019, net capital increased by 6.8% compared to the end of 2018, capital adequacy ratio increased by 49 bps from the end of 2018. ✓Built a steady internal capital adequacy evaluation procedure. According to the Bank’s comprehensive risk management framework, various substantive risk assessments, and results of stress tests, the Bank rationally planned its capital usage, so that the Bank’s capital adequacy level, operational planning and financial planning achieved a dynamic balance. ✓ Adhere to the capital constraint principle, Capital adequacy adequacy ratio 2018.12 2019.12 ratio enhanced capital management. Comprehensive application of risk pricing mechanism across the Bank, which based on risk-adjusted returns, and solidified into operation systems, in order to realize the differentiated risk pricing on transaction-by-transaction manner, and maximized the risk-adjusted return of the Bank’s assets. Source: Annual Report 22 Assets Quality Remained Stable And Controllable, Impairment Provision Sufficiently Accrued Loan impairment loss reserve ratio Assets quality (RMB 100million ) 74.69 43.97 80.08 2.94% 3.04% 2018.12 2019.12 52.52 NPLs Balance of loan impariment provision 2018.12 2019.12 Non-performing Loan ratio NPL ratio of City Commercial Banks avg. NPL ratio of the Bank 1.79% Assets quality control measures ✓ Utilized advanced fin-tech applications to build a intelligential risk control system. 2.32% 1.99% 1.73% ✓ Strengthened the credit assets quality control of entire business process for existing customers, to prevent downward movements of asset quality indicators. ✓ Rigorous control of new customers' entrance, imposed quota management in term of industrial, regional and highly risky areas. 2018.12 2019.12 ✓ Established a centralized collection mechanism for non-performing assets, and implement rigid ownership transfer management. Source:Annual Report 23 Risk Control Kept Strengthening, Risk Management System Increasingly Improved Credit Risk Risk measurement model was continuously improved, and the results of the internal evaluation system were in-depth applied in areas such as customer entrance, post-loan management, risk policy, risk pricing, provision for impairment, and economic capital. In the aspect of collateral risk valuation, the Bank established an automatic evaluation model for office buildings, started to establish the commercial housing automatic evaluation model and the land managerial right database, in order to plentiful the collateral risk valuation system. Liquidity Risk Improved the level of cash position management meticulousness, proactively adjust structure of assets and liabilities, proportion of retail deposits increased and interbank liabilities decreased both significantly, in result, the liquidity risk resistance capacity enhanced. Market Risk Comprehensively implemented market risk management preferences, optimized market risk management and control procedures, ensure that market risk management is accurately measured, carefully managed, properly implemented and effectively prevented. Operational Risk Strengthened the substantive application of the three major management tools of operational risk, namely RCSA, KRI and LDC, and effectively prevent the occurrence of operational risk events in high-risk areas. Information Technology Risk Refined the IT management process, the disaster recovery and switching work of the new core system has completed in August 2019, business continuity construction made substantive breakthrough, while enhanced the IT outsourcing management, and consistently improve the outsourcing risk management capacity. Compliance Risk Deepened the integrated managerial method of "prevention, control, inspection and revise", prompted the level of internal control and compliance management meticulousness, and improved the business suitable comprehensive internal control and compliance risk management system development and transform. 24 04 Prospect 25 Main Strategic Plan For 2020 Determine to win the “3 major battles” and promote the re-escalating of operating profitability and quality. Progress While maintaining stability is the keynote Take the initiative to adapt new situation Deepen the implementation of transformation and promote the re-upgrading of strategic competitive advantage. Strengthen business characteristic and comparative advantages, promote the re-escalating of regional market share. Rigorous abide by the bottom line of risk, and promote the re-upgrading internal control and governance of risk. Improve risk management strategy Consolidate and deepen transformation and reform Deepen intellectual operation and promote re-upgrading of fin-tech supportive capacity. Reform the policy-making mechanism and promote the re-upgrading of operation and management efficiency. Grasp foundation remodeling and promote the re-upgrading of the fundamental governance capacity. 26 Appendix:Financial Statements Of 2019 Profit & Loss (Million RMB) 2019 Jan-Dec 2018 Jan-Dec Operating income 15,124.4 14,325.4 5.58% Of which: Net interest income 10,836.1 10,127.0 7.00% Net fee and commission income 2,225.6 2,391.4 6.93% Net profit 3,635.1 5,574.4 -34.79% Net profit attributable to shareholders of the Bank 3,558.4 5,548.6 Net assets per share attributable to shareholders of the Bank 4.53 4.21 Profitability(%) 2019 Jan-Dec 2018 Jan-Dec Return on average total assets 0.61 Return on average equity 7.41 0.94 Change 35.87% 7.60% Change % points 0.33 12.68 5.27 Assets & Liab. (Million RMB) 2019.12.31 2018.12.31 Total assets 583,089.4 615,588.5 5.28% Of which: Loans and advances to customers 263,604.1 253,762.7 3.88% Total Liabilities 531,448.2 568,097.0 6.45% Of which: Due to customers 425,683.7 395,516.8 7.63% Share capital 10,995.6 10,995.6 — Total equity 51,641.2 47,491.5 8.74% 2019.12.31 2018.12.31 NPL ratio 1.99 1.73 0.26 Impairment losses on loans 3.04 2.94 0.10 Impairment coverage ratio 152.50 169.88 17.38 Core tier 1 capital adequacy ratio 10.22 9.74 0.48 Assets quality indicators(%) Change Change % points Net interest spread 1.87 1.67 0.20 Net interest margin 1.95 1.87 0.08 Tier 1 capital adequacy ratio 10.24 9.75 0.49 Net fee and commission income to operating income ratio 14.72 16.69 1.97 Capital adequacy ratio 12.53 12.15 0.38 Cost-to-income ratio 32.71 Loan-deposit ratio 61.92 64.16 2.24 27 30.88 1.83 Source:Annual Report Thank you!