 哈尔滨银行2019中期业绩发布会-ENG.pdf
哈尔滨银行2019中期业绩发布会-ENG.pdf
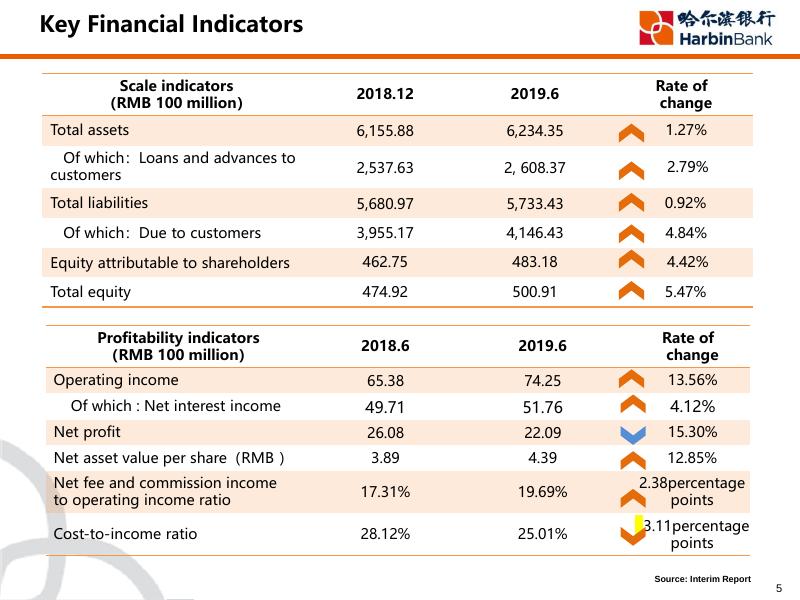
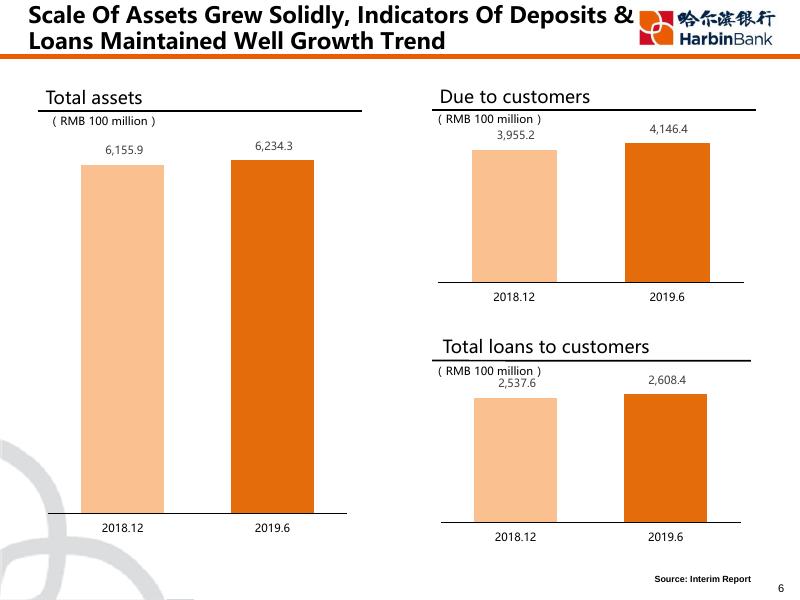
Stock code:HK.6138 30 August 2019, Hong Kong Disclaimer The information contained in this material does not form an offer or an invitation proposal to purchase or subscribe the securities of Harbin Bank Co., Limited (the “Company") in Hong Kong, the United States or any other regions. The securities of the Company is neither registered under the Securities Act of 1933 nor in its revision, shall not be offered or sold in the United States, except its registration in accordance with the applicable laws or exempted from registration. This announcement contains “forward-looking statements” defined in Article 27A of the Securities Act of 1933 (Revised) and Article 21E of the Securities Exchange Act of 1934 (Revised). These forward looking statements involve known or unknown risks, uncertainties and other factors, and are made based on the Company's existing industry expectations, assumptions, forecast and prediction. Unless otherwise required by law, the Company does not undertake any obligation to update forward-looking statements to reflect events or circumstances in the future will not bear the corresponding changes to its expected duty. Although the Company believes that the expectation described in the forward-looking statements are reasonable, it does not assure you that the expectations in the future will prove to be correct, and investors should pay attention that the actual results may have difference with the prediction results. 2 Content 1 Financial Performance 3 2 Business Operation Risk Management 4 Prospect 3 01 Financial Performance 4 Key Financial Indicators Scale indicators (RMB 100 million) 2018.12 2019.6 Rate of change Total assets 6,155.88 6,234.35 1.27% Of which:Loans and advances to customers 2,537.63 2, 608.37 2.79% Total liabilities 5,680.97 5,733.43 0.92% Of which:Due to customers 3,955.17 4,146.43 4.84% Equity attributable to shareholders 462.75 483.18 4.42% Total equity 474.92 500.91 5.47% 2018.6 2019.6 Rate of change 65.38 74.25 13.56% 49.71 51.76 4.12% Net profit 26.08 22.09 15.30% Net asset value per share(RMB ) 3.89 4.39 12.85% Net fee and commission income to operating income ratio 17.31% 19.69% 2.38percentage points Cost-to-income ratio 28.12% 25.01% 3.11percentage points Profitability indicators (RMB 100 million) Operating income Of which : Net interest income Source: Interim Report 5 Scale Of Assets Grew Solidly, Indicators Of Deposits & Loans Maintained Well Growth Trend Due to customers Total assets ( RMB 100 million ) 6,155.9 6,234.3 ( RMB 100 million ) 3,955.2 4,146.4 2018.12 2019.6 Total loans to customers ( RMB 100 million ) 2,537.6 2018.12 2019.6 2018.12 2,608.4 2019.6 Source: Interim Report 6 Income-Generating Capacity Was Steadily Improved , Cost Management Achieved Remarkable Results Operating income ( RMB 100 million ) Cost-to-income ratio 74.25 28.12% 2019.6 2018.6 65.38 2018.6 Net profit 25.01% 2019.6 Net assets value per share ( RMB per share) ( RMB 100 million ) 4.39 3.89 26.08 22.09 2018.6 2019.6 2018.6 2019.6 Source: Interim Report 7 Interest Income Continuously Increased, Profitability Remained Stable Interest income Interest income structure ( RMB 100 million ) Investments in debt securities 2019.6 2018.6 51.76 49.71 32.6% 94.38 Cash and balances with the Central Bank 87.25 Due from banks and other financial institutions 3.7% 5.4% 2.5% Long-term receivables 55.8% Net interest income Interest expense Yield of interest earning assets 5.18% 2018.6 Loans and advances to customers 4.93% 2019.6 Cost rate of interest-bearing liabilities 3.52% 3.38% 2018.6 2019.6 Source: Interim Report 8 Growth of Non-interest income Accelerated, Business Structure Was Continuously Optimized Fee and commission income Fee and commission income structure ( RMB 100 million ) 2019.6 14.62 0.74 Settlement fee 3.0% 33.1% Advisory and consultancy fee 2018.6 11.32 1.67 Others 22.4% 1.6% 39.9% Net fee and commission income Bank card fee Fee and commission expense Net fee and commission income to operating income ratio Agency and custodian fee Other non-interest income ( RMB 100 million ) 19.69% 17.31% 5.16 2018.6 2019.6 4.08 2.24 0.21 Net trading income Net profit or loss 2018.6 2019.6 or loss on financial 0.06 0.47 Other profit or loss,net investment Source: Interim Report 9 02 Business Operation 10 Regional Development Was Increasingly Balanced , And Branches Operated Steadily City Commercial Bank with Most Domestic Subsidiaries ✓ Harbin Branch 131 Sub branches Heilongjiang Harbin Branch ✓ 5 Branches outside Heilongjiang Jilin 73 Sub branches Liaoning Beijing ✓ 11 Provincial branches Gansu ✓ 32 Village and township banks 36 Sub branches Tianjin Branch Hebei 75 Sub branches Sichuan ✓ Harbin Bank Financial Leasing Co., Ltd. ✓ Harbin Bank Consumer Finance Co., Ltd. Jiangsu Henan Chengdu Branch Hubei Hunan Shenyang Branch Dalian Branch Jiangxi Chongqing Branch Guangdong Hainan Provinces/Municipalities with Business Institutions Source: Interim Report 11 The Advantages Of Holding Licenses Tended To Emerge, With Well Developing Tendency At Group Level Total assets of HB Leasing Total assets of HBCF ( RMB 100 million ) ( RMB 100 million ) 279.6 105.3 233.7 71.6 2018.12 2019.6 Net profit of HB Leasing 2018.12 2019.6 Net profit of HBCF ( RMB 100 million) ( RMB 100 million) 0.60 1.56 0.19 -0.38 2018.6 2019.6 2018.6 2019.6 Source: Interim Report 12 Retail Finance Developed in a Good Momentum, Deposits And Loans Indicators Was Steadily Improved Operating income of retail finance Total retail loans ( RMB 100 million ) 21.64 ( RMB 100 million ) 2018.6 23.74 2019.6 Total deposits from retail customers ( RMB 100 million ) 1,237.6 1,153.9 2018.12 2019.6 The proportion of retail deposit 1,866.4 1,423.1 36% 45% Retail deposits 2018.12 2018.12 2019.6 2019.6 Other deposits Source: Interim Report 13 Customer Base Grew Steadily, And The Credit Card Business Developed Solidly Customer number of deposit ( ten thousand accounts) 1,225.3 2018.12 1,283.8 2019.6 The number of debit cards issued ( ten thousand ) 1,540.1 2018.12 1,613.5 2019.6 The number of retail customers with personal financial assets (in RMB and other foreign currencies) over RMB 50,000 The number of credit cards issued ( ten thousand accounts) ( ten thousand ) 65.87 56.85 2018.12 90.80 74.76 2019.6 2018.12 2019.6 Source: Interim Report 14 The Status Of Microcredit Finance Was Consolidated And Featured Business Operated Well Total microcredit Microfinance business (RMB 100 million) loans to farmers personal consumption loans loans to small enterprise loans to small enterprise owners 1,807.2 1,824.0 129.1 141.8 ✓Complete on-line operation system, a combination of standardization and customization ✓Life cycle mechanism and dynamic adjustment of credit score ✓ Establishing a long-term risk monitoring mechanism through the application of internal evaluation in the whole process Consumer finance 696.2 719.3 653.3 586.4 ✓ Expanding high quality business platform and broadening financial scene ✓ Combining Big Data with finance to expand inclusive finance ✓Optimizing risk control model to control business risk Agriculture finance ✓ Breaking seasonal restrictions and establishing a 328.7 376.5 2018.12 2019.6 year-round marketing model ✓ Breaking regional restrictions and establishing national marketing program ✓Science and technology & characteristic service, achieving complete on-line mode step by step Source: Interim Report 15 Sino-Russia Finance Kept Market Leadership, Cross-border E-commerce Developed Well Ruble spot exchange trading volume The transaction amount of E-commerce platform (Ruble 100 million) 500.0 (RMB 100 million) 8.88 9.32 2019.6 2018.6 2019.6 113.6 2018.6 Sino-Russia finance and international business ✓ The profit of sino-Russia finance is 57.13 million RMB; ✓ Cross-border Cash Transfer of RMB accumulated to note:no VISA channel is included in the transaction amount of 2018. Number of platform merchants (accounts) 2,186 2,315 155 million; ✓ 22 account banks in Russia; ✓ The membership of Sino-Russian Financial Union has grown to 72 ; ✓ Credit to Russian counterparts is about RMB 7 billion. 2018.12 2019.6 Source: Interim Report 16 Corporate Finance Developed Steadily With Continuously Optimized Business Structure Operating income of corporate finance Average daily corporate deposits ( RMB 100 million ) ( RMB 100 million ) 28.73 19.56 2018.6 2019.6 2018.6 Interest rate of corporate deposits and loans 6.09% 3.06% 2,395.6 2,212.1 2019.6 Deposit structure of corporate finance 6.20% 35.1% 3.00% 42.9% 64.9% Avg. cost rate of Avg. return rate of corporate deposits corporate loans 2018.6 2019.6 2018.12 57.1% Current deposit 2019.6 Time deposit Source: Interim Report 17 Financial Market Business Developed Steadily With Well Yielding Bond Investments The balance of securities investments and other financial assets Total bond investment ( RMB 100 million ) 679.0 2018.12 731.1 2,364.3 2,260.1 2018.12 2019.6 Bond trading volume (RMB trillion) ( RMB 100 million ) 2019.6 Cost of due to banks 4.60 4.98% 4.79% 4.39% 3.97% 1.67 Due to banks 2018.6 2019.6 Issued debt securities and others 2018.6 2019.6 Source: Interim Report 18 Allocated More Resource Into Fin-Tech, Ensured And Improved Daily Operations Internet banking customer number (ten thousand) Mobile banking customer (ten thousand) We-chat banking customer (ten thousand) 276.0 230.2 51% 2019.6 2018.12 Mobile Channel Replacement Rate 2018.12 2018.12 91% 2019.6 2018.12 Number of self-service equipment (sets) 94 13 2019.6 60% 2019.6 93 238.2 2018.12 2019.6 158.7 117.2 2018.12 222.4 134 Electronic Channel Replacement Rate 94% 2019.6 475 342 474 331 172 14 card issuance machines multi-media inquiry machines smart cabinets ATMs BCDMs Source: Interim Report 19 Continuous Improvement Of Market Image, And Brand Features Became More Distinctive 217th in "Top 1000 World Banks 2018 " according to The Banker of UK Ranked 34th in China's Top 100 Bank of 2018 by China Banking Association Best Compliance Performance (Asia-Pacific Region) China Financial Innovation Award 2019— Top 10 of Private Enterprises Financial Service Innovation Awards Top 100 of Clearing Excellent self-operated institution award Holding the 70th Anniversary of Sino-Russian Diplomacy The 5th meeting of Sino-Russia Financial Council 《Forbes》 “Top 2000 Global Listed Companies” Ranked 1117th Sponsored the Harbin International Marathon which has been awarded "Gold Medal Event" by China Athletics Federation Source: Interim Report 20 03 Risk Management 21 Steadily Improved Capital Adequacy Level, With More Proactive Capital Managerial Approaches Utilized Capital management – more proactive Capital Adequacy Ratio 12.15%12.29% 9.74% 9.89% 9.75% 9.91% Core tier 1 captial Tier 1 capital Capital adequacy adequacy ratio adequacy ratio ratio 2018.12 2019.6 ✓ (RMB 100million) 608.4 582.2 2018.12 Tier 1 capital ✓ According to the strategic objectives and development of establishing a specialized micro-finance bank, capital was prioritized to allocate into micro-finance business stream. Net Capital 467.4 Further improved the capital management mechanism, effectively conducted regulatory requirements, carried out the requirements of capital management as preplanned, and continued to strengthen the fundamental capital management capacity construction, to further enhance the capital affection on transmitting and restraint to business development. At the end of June 2019, net capital increased by 4.5% compared to the end of 2018, capital adequacy ratio increased by 14 bps from the end of 2018. 490.6 2019.6 Net capital ✓ According to the relevant requirements of the 《 Measures for Capital Management of Commercial Banks (trial implementation) 》 , investing capital into business areas with relatively low capital occupancy and relatively high returns. The Bank meets the minimum capital requirements, capital reserve requirements and counter-cyclical capital requirements of the CBIRC’s transitional period arrangements. Source: Interim Report 22 Assets Quality Remained Stable And Controllable, While Risk Resistance Ability Enhanced Loan impairment loss reserve ratio Assets quality ( RMB 100million ) 74.69 43.97 81.54 2.94% 3.13% 49.35 NPLs 2018.12 2019.6 Balance of loan impairment 2019.6 provision Non-performing Loan ratio NPLs ratio City Commercial Bank Avg. 2018.12 Assets quality control measures promoting the assets quality control ✓ Fully throughout whole process. 2.30% 1.79% adjusted credit loans structure, ✓ Proactively increased the proportion of retail. improved, centralized and vertical credit ✓ An approval managerial mode. 1.73% 2018.12 1.89% 2019.6 and improved an intelligent risk ✓ Constructed control system. strength on assets disposal and ✓ Increased write-off. Source: Interim Report , CBIRC 23 Risk Control System Increasingly Improved, Which Lifted The Supporting Competency Credit Risk Focused on the precise management of risk and strengthened the rigid control of the system. Established the concept of proactive risk management and conducted differentiated managerial standards. Continued to deepen the restructuring of the customer structure, strictly controlled the risk of new customers, to achieve the optimal allocation of assets for the Bank, stabilized and controlled the quality of assets. Liquidity Risk Actively adjusted the structure of assets and liabilities, strictly controlled the dependency of due to other banks, strengthened maturity mismatch management, reasonably set liquidity gap indicators, tamped the basis of liquidity risk management. Market Risk Comprehensively promoted the reliability measurement of market risks, strengthened the seriousness of quota management, continuously improved the market risk management system. Operational Risk Strengthened the practical application of the three management tools,, namely RCSA, KRI, and LDC, in order to effectively prevent operational risk in high risky areas. Information Technology Risk Further refined the information technology management procedures, strengthened the drill of information system, set up the information technology outsourcing management team, and improved the level of outsourcing risk management. Compliance Risk A comprehensive and effective compliance risk management system has been established, and three lines of defense for compliance risk management have been improved. Through continuous improvement of compliance risk management functions and improvement of risk management level, in order to effectively identification and management of compliance risk. 24 04 Prospect 25 Main Strategic Plan For Second Half Of The Year Tackle difficulties of the three major campaigns, through business to promote the effectiveness Back-tobasics Making progress while ensuring stability Promote the three major transformations, strengthen the foundation of the customer base Strengthen the three major businesses, cultivate value and enhance the momentum Strict Risk Control Strengthening governance Implement three major projects to enhance IT system operational capabilities Consolidate the three major supporting safeguard and continue to incubate the fundamental capabilities 26 Q&A! Appendix:Financial Statements Of 2019 H1 Profit & Loss (Million RMB) 2018 Jan-Jun 2019 Jan-Jun Change Operating income 6,537.8 7,424.6 13.56% Of which: Net interest income 4,971.1 5,175.8 Net fee and commission income 1,131.5 Net profit Assets & Liab. (Million RMB) 2018.12.31 2019.6.30 Change Total assets 615,588.5 623,434.7 1.27% 4.12% Of which: Loans and advances to customers 253,762.7 260,836.8 2.79% 1,462.2 29.23% Total Liabilities 568,097.0 573,343.3 0.92% 2,608.0 2,208.9 -15.30% Of which: Due to customers 395,516.8 414,642.6 4.84% Net profit attributable to shareholders of the Bank 2,605.8 2,175.7 -16.51% Share capital 10,995.6 10,995.6 —— Net assets per share attributable to shareholders of the Bank Total equity 47,491.5 50,091.4 5.47% 3.89 2018.12.31 2019.6.30 Change % points Core tier 1 capital adequacy ratio 9.74% 9.89% 0.15 Tier 1 capital adequacy ratio 9.75% 9.91% 0.16 Capital adequacy ratio 12.15% 12.29% 0.14 NPL ratio 1.73% 1.89% 0.16 Impairment losses on loans 2.94% 3.13% 0.19 Impairment coverage ratio 169.88% 165.25% -4.63 Other indicator(%) 2018.12.31 2019.6.30 Change % points 64.16% 62.91% -1.25 4.39 12.85% Profitability(%) 2018 Jan-Jun 2019 Jan-Jun Change % points Return on average total assets 0.92% 0.71% -0.21 Return on average equity 12.40% 9.20% -3.20 Net interest spread 1.66% 1.55% -0.11 Net interest margin 1.88% 1.75% -0.13 Net fee and commission income to operating income ratio 17.31% 19.69% 2.38 Cost-to-income ratio 28.12% 25.01% -3.11 Assets quality indicators(%) Loan-deposit ratio Source: Interim Report 28 Thank you!